
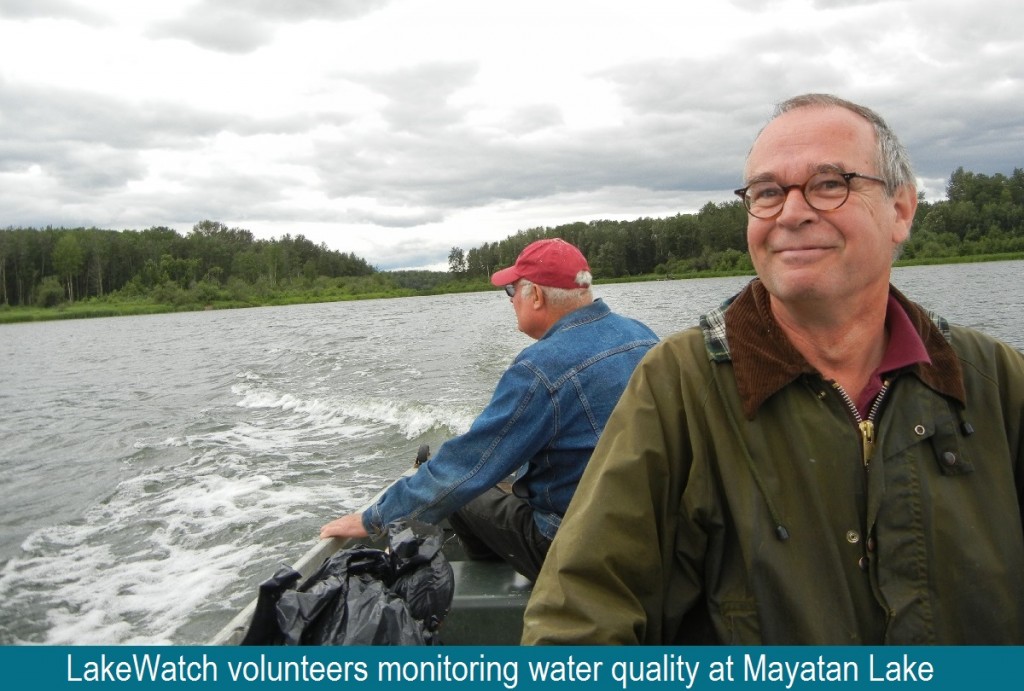
In 2016, ALMS received funding from the Beaver River Watershed Alliance through the Lakeland Industry and Community Association (LICA), Environment Canada, the Red Deer River Watershed Alliance, the Pigeon Lake Watershed Association, the MD of Wainwright, Cargill and Alberta Environment and Parks, to conduct LakeWatch, a volunteer based water quality monitoring program.
Data presented below has not completed its final validation process.

Sample Record
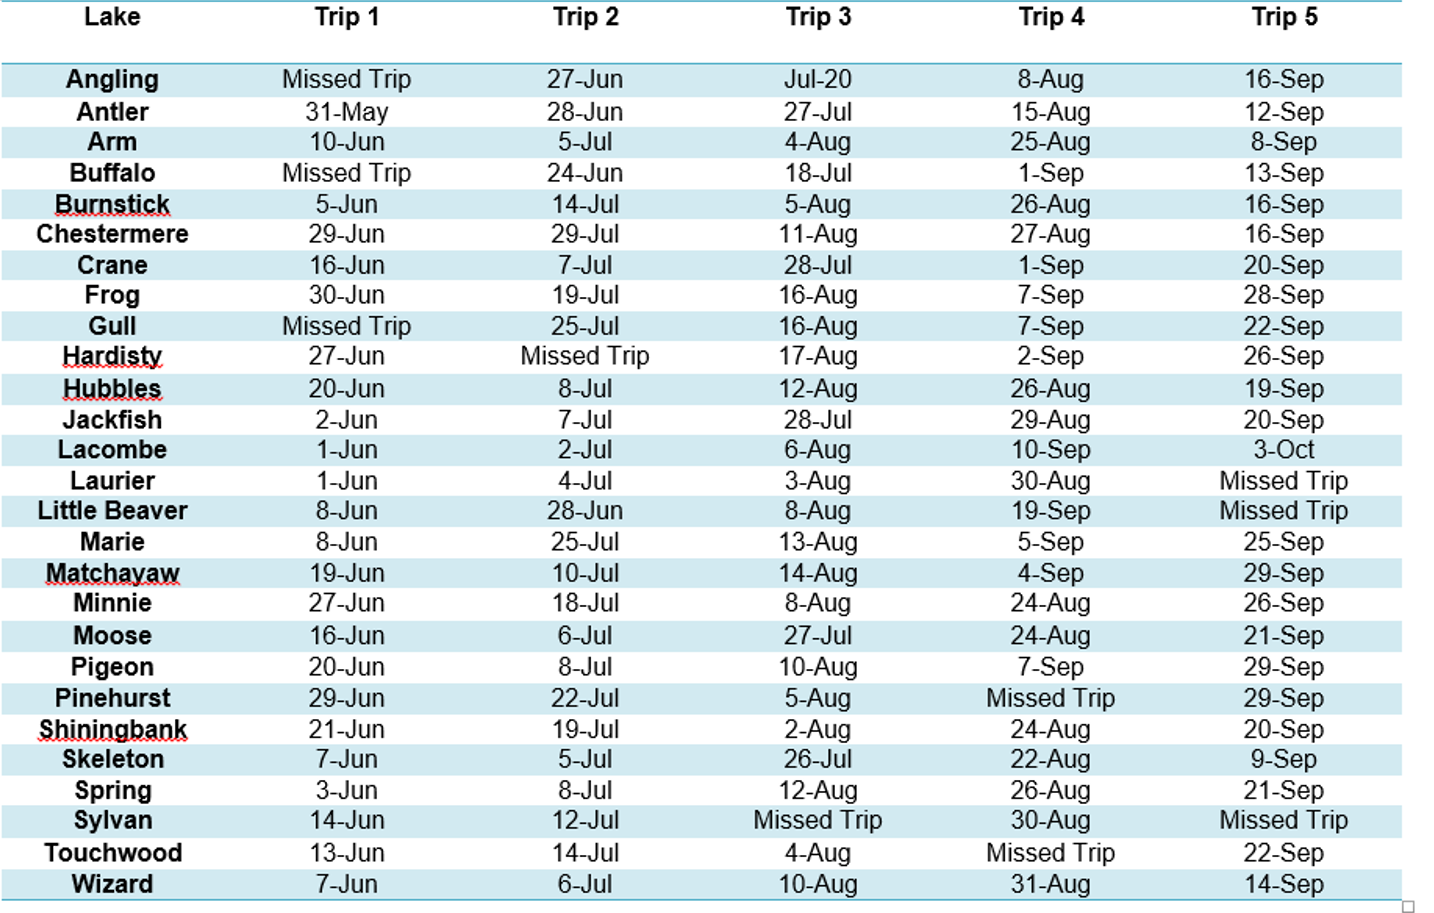
Three summer field technicians (Ageleky Bouzetos, Breda Muldoon and Alicia Kennedy) were hired in May of 2016 to conduct the water quality sampling. Each lake was to be visited five times throughout the summer, and, in 2016, 125 of 135 scheduled trips were completed. This resulted in a completion rate of 93% (Table 1). Missed trips were a result of volunteer availability and unsafe weather.
Table 1: The LakeWatch sample completion record for 2016.
Volunteers
In 2016, ALMS worked with 80 unique volunteers for a total of 571 volunteer hours spent sampling lakes. Each year, ALMS recognizes one volunteer who has shown outstanding dedication and commitment to the LakeWatch program. This year, Bev Smith of Laurier Lake was presented with the LakeWatch Volunteer of the Year Award (Figure 1).
Figure 1: LakeWatch Volunteer of the Year (2016) recipient Bev Smith with Executive Director Bradley Peter and LakeWatch Technician Alicia Kennedy.
Results
While ALMS collects a large suite of water chemistry parameters, this report will attempt to highlight the variability which exists across only a few of our major parameters: Secchi Depth, Total Phosphorus, Chlorophyll-a, and Microcystin. The variation within these parameters does not necessarily reflect a degree of lake management, for many factors outside of human control also impact lake water quality. The depth of the lake, the size of the drainage basin, lake order, and the composition of bedrock and sediment are just some of the factors which affect lake water quality and should be taken into consideration when reading these results.
Secchi Depth:
Average Secchi depths in 2016 ranged from a minimum of 0.40 m at Antler Lake to a maximum of 5.55 m at Hubbles Lake (Figure 2). Water clarity at Antler and Little Beaver Lake appears to be most negatively impacted by algal blooms, and Secchi depth averages were significantly correlated with average chlorophyll-a concentrations across lakes (r = 0.89, df = 25, p-value = 4.85 x 10⁻¹⁰).
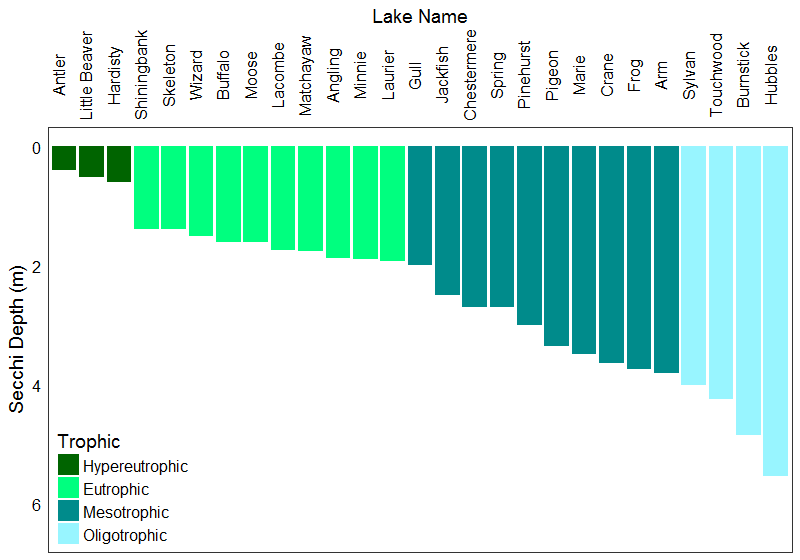
Figure 2: Average Secchi disk depths measured during the summer of 2016.
Total Phosphorus:
Average total phosphorus concentrations ranged from a minimum of 9 μg /L at Burnstick Lake to a maximum of 380 μg/L at Antler Lake (Figure 3). Antler and Little Beaver Lake were classified as hypereutrophic, and only Burnstick Lake was classified as oligotrophic.
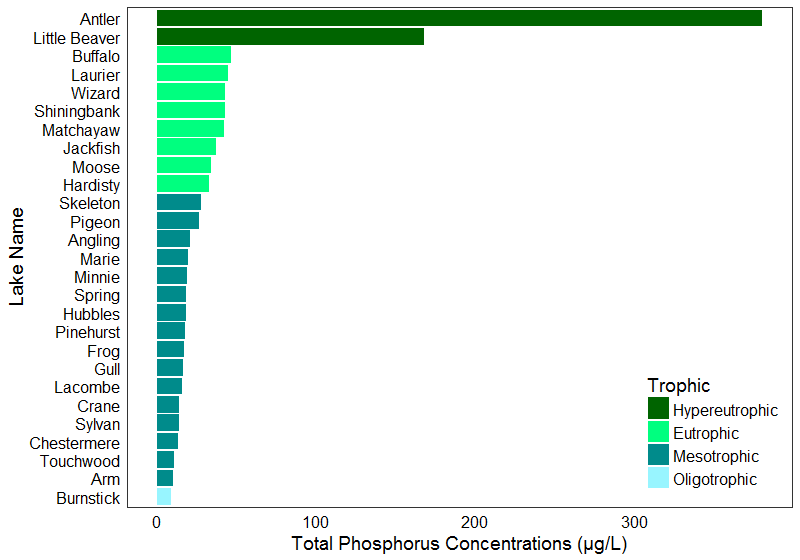
Figure 3: Average total phosphorus concentrations measured in the summer of 2016.
Chlorophyll-a:
Average chlorophyll-a concentrations ranged from a minimum of 3.4 μg /L at Touchwood Lake to a maximum of 121 μg /L at Antler Lake (Figure 4). Chlorophyll-a and TP averages were significantly correlated across lakes (r = 0.89, df = 25, p-value = 3.63 x 10⁻¹⁰).
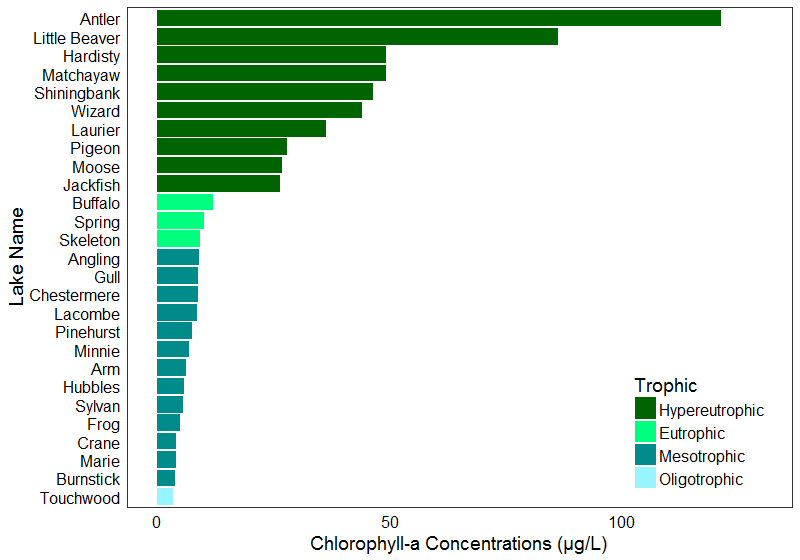
Figure 4: Average chlorophyll-a concentrations measured in the summer of 2016.
Microcystin:
Average microcystin concentrations fell below the minimum detection limit of 0.1 μg/L at Chestermere, Marie, Pinehurst, Touchwood, Burnstick, Arm and Spring Lakes (Figure 5). Microcystin was detected at every other lake, with the highest average concentration observed at Little Beaver Lake, measuring 5.03 μg /L. None of the lakes sampled measured higher than the recreational guideline of 20 μg /L at any time throughout the summer of 2016.
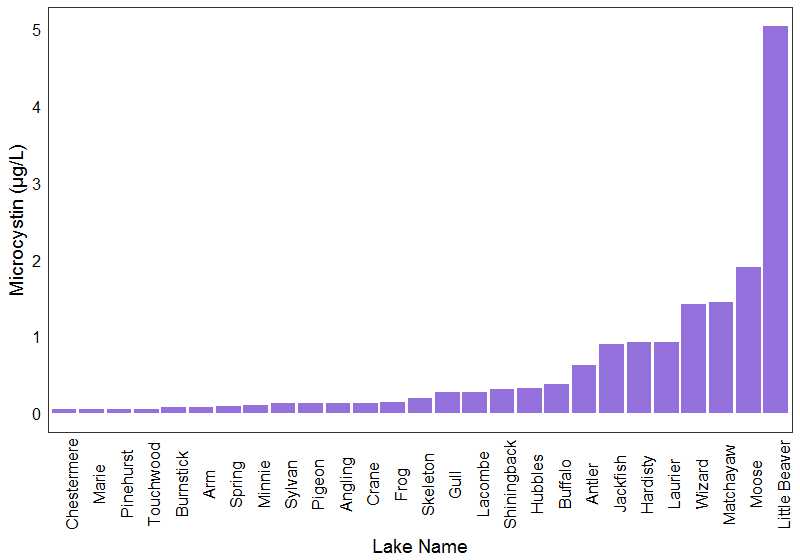
Figure 5: Average microcystin concentrations measured during the summer of 2016.
Downloads
PDF of the 2016 summarized LakeWatch results
A detailed data summary of each lake sampled can be found in the 2016 LakeWatch reports which will be published late this spring.

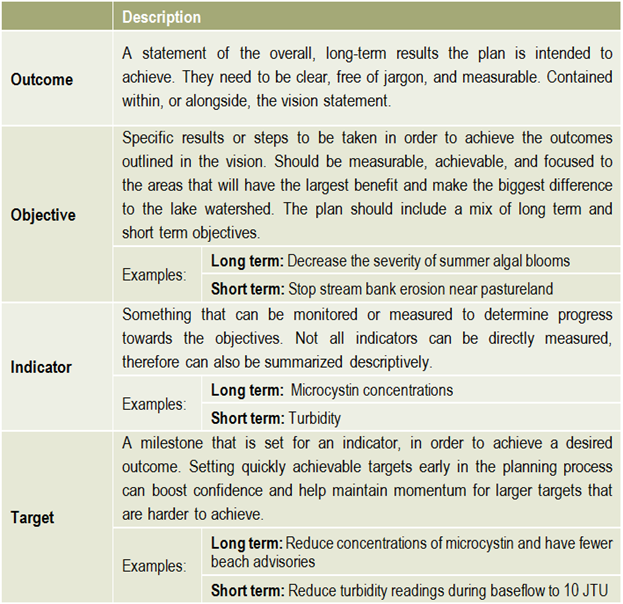
 The members of the steering committee will continue to play a strong role in facilitating and tracking implementation actions. This includes any actions they were responsible for, as well as tracking other committees and sector’s actions and progress made towards achieving the plan’s outcomes. Ongoing communication is essential to successful implementation and achieving outcomes, therefore a regular reporting mechanism could be set up in order to provide regular evaluation of the plan.

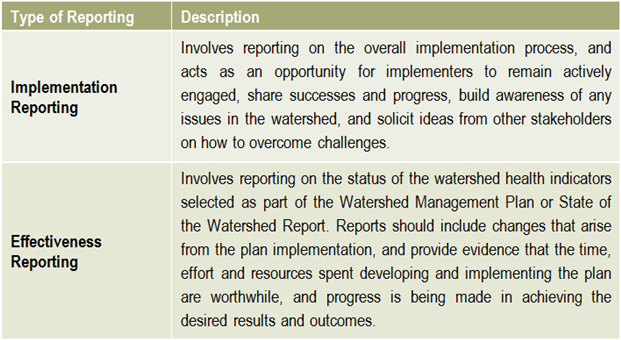 Reporting is an essential component of any watershed management planning and implementation process. There are two main types of reporting that should be shared with stakeholders on a regular basis: implementation reporting & effectiveness reporting.
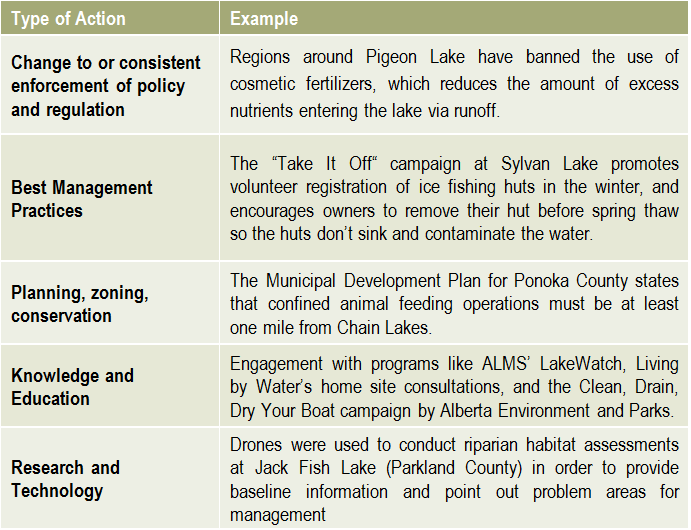 There is no limit to the number or types of lake management actions, but they typically fall into the categories on the right.
 Helpful resources
 The development of a lake watershed management plan provides the guidance needed to implement activities, but the plan cannot be static. Monitoring the performance of your management actions is essential to understanding whether your goals have been met, and whether further actions are needed. Monitoring and evaluating the implementation and effectiveness of a lake watershed management plan allows assessment of progress towards the goals and objectives of the plan, identification of problems and opportunities, and a collection of critical information required when performing a 5 or 10 year review of the plan.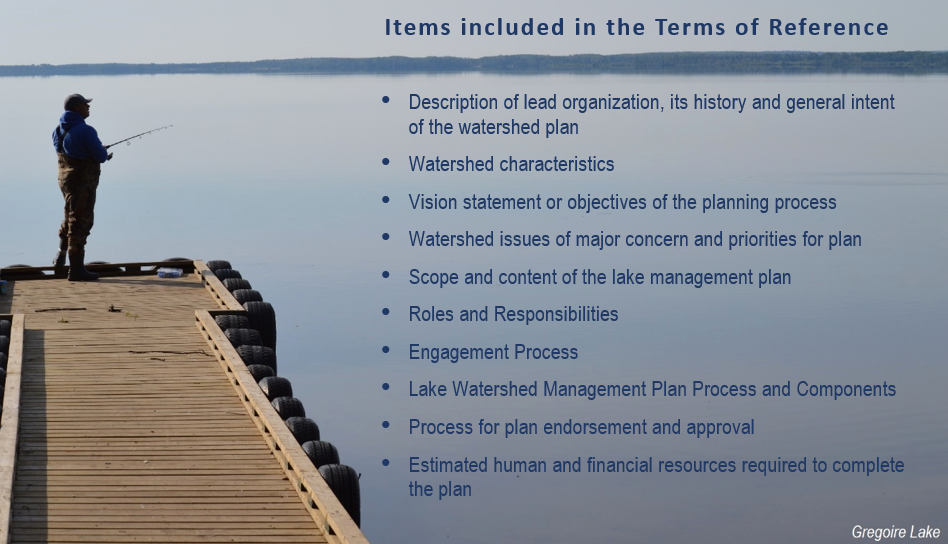
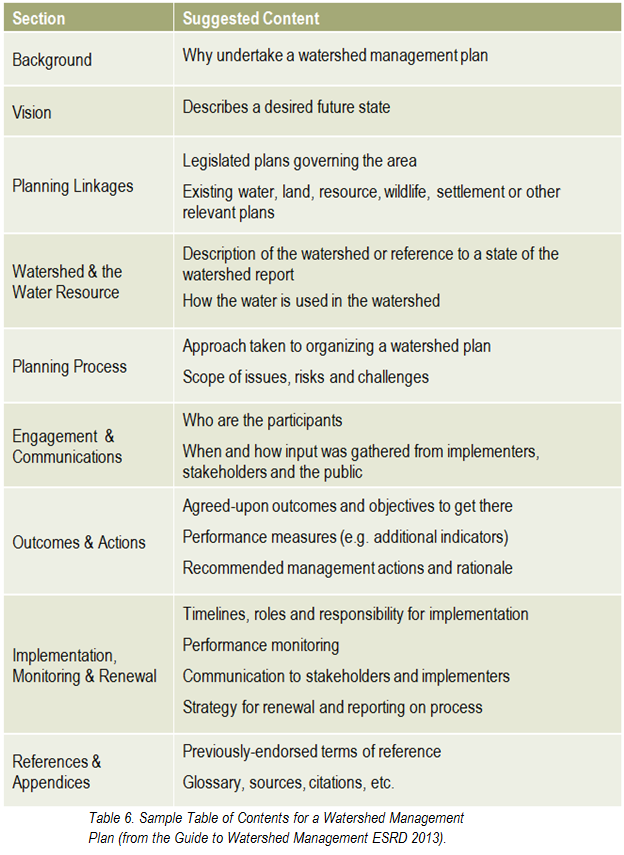
 What has the monitoring results of the plan and of the indicators shown? Is there a need to modify the plan? It is important that the lake watershed management plan does not just sit on a shelf. Information gaps should be addressed, action items need to be managed, completed, and evaluated to best address the needs of the lake. Always keep in mind the vision: if the actions taken are not bringing the lake closer to that vision, then the plan needs to be modified. Consider updating both the state of the watershed and the lake watershed management plans at regular intervals to make sure that the actions taken were achieving the desired outcomes and to evaluate what work still needs to be done.
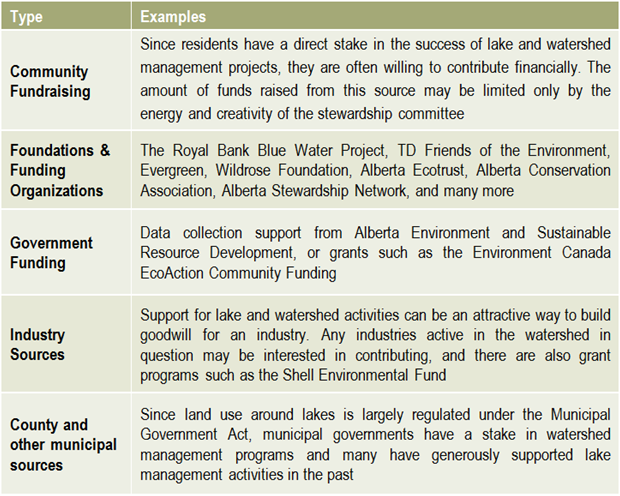 Once a plan has been approved by all affected sectors and officially endorsed and released by the steering committee, then implementation can begin in full. Action projects can be large and comprehensive, or made smaller by staging projects over time or into modules that can be tackled one at a time. Fundraising is an issue that many community groups may find intimidating, but experience with programs such as the Pine Lake Restoration Program (see
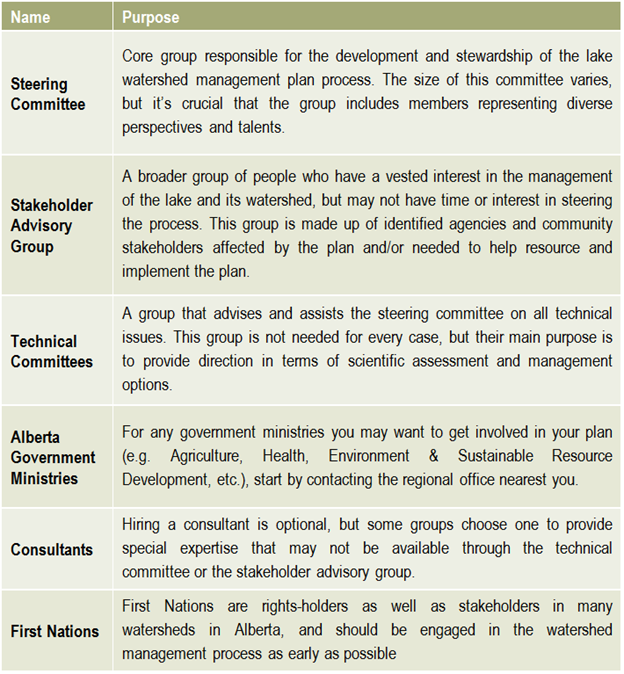
 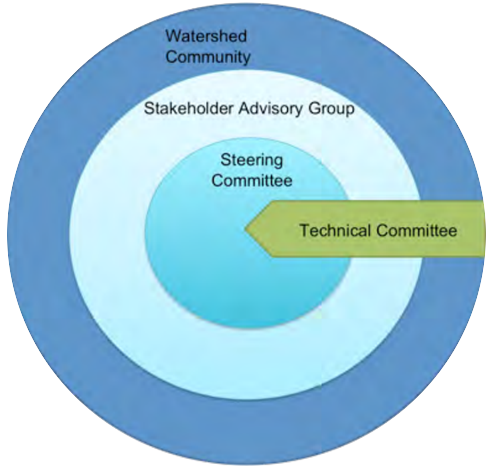 This graphic describes how the various committees and groups will work and interact together. The circle size depicts the approximate number of people involved, and the circles overlapping indicates that some individuals may reside in all of the circles and participate in multiple committees as part of the planning process. The technical committee is shown as an arrow, indicating that it is independent and has relatively few people, and yet it interacts with all of the groups. This graphic may look different depending on the lake and the people involved, and a detailed structure should be agreed upon and described in the plan’s Terms of Reference (Step 6).
Recent Comments