Lakes and Shoreline per County/Municipal District in Alberta
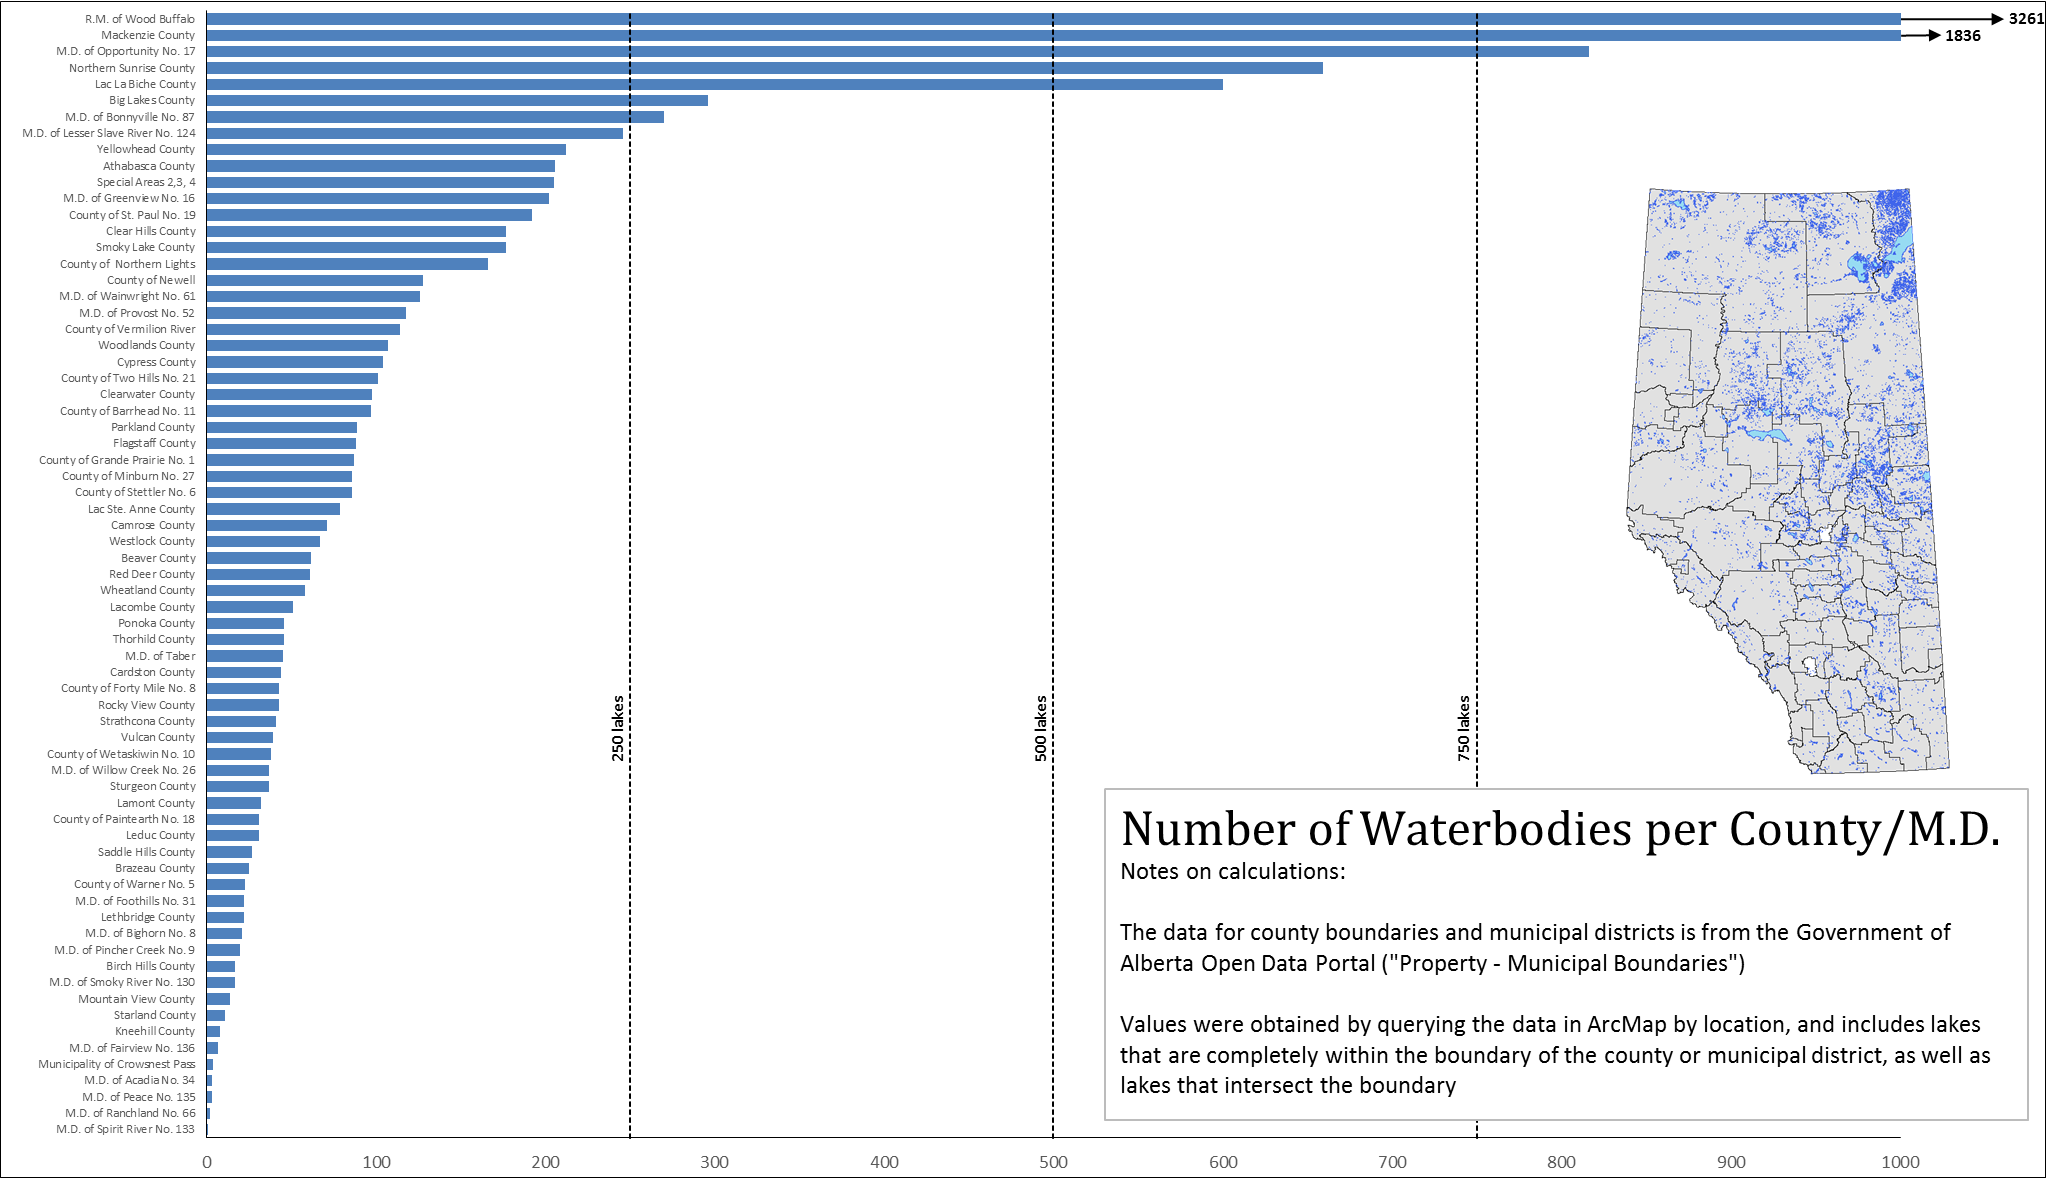
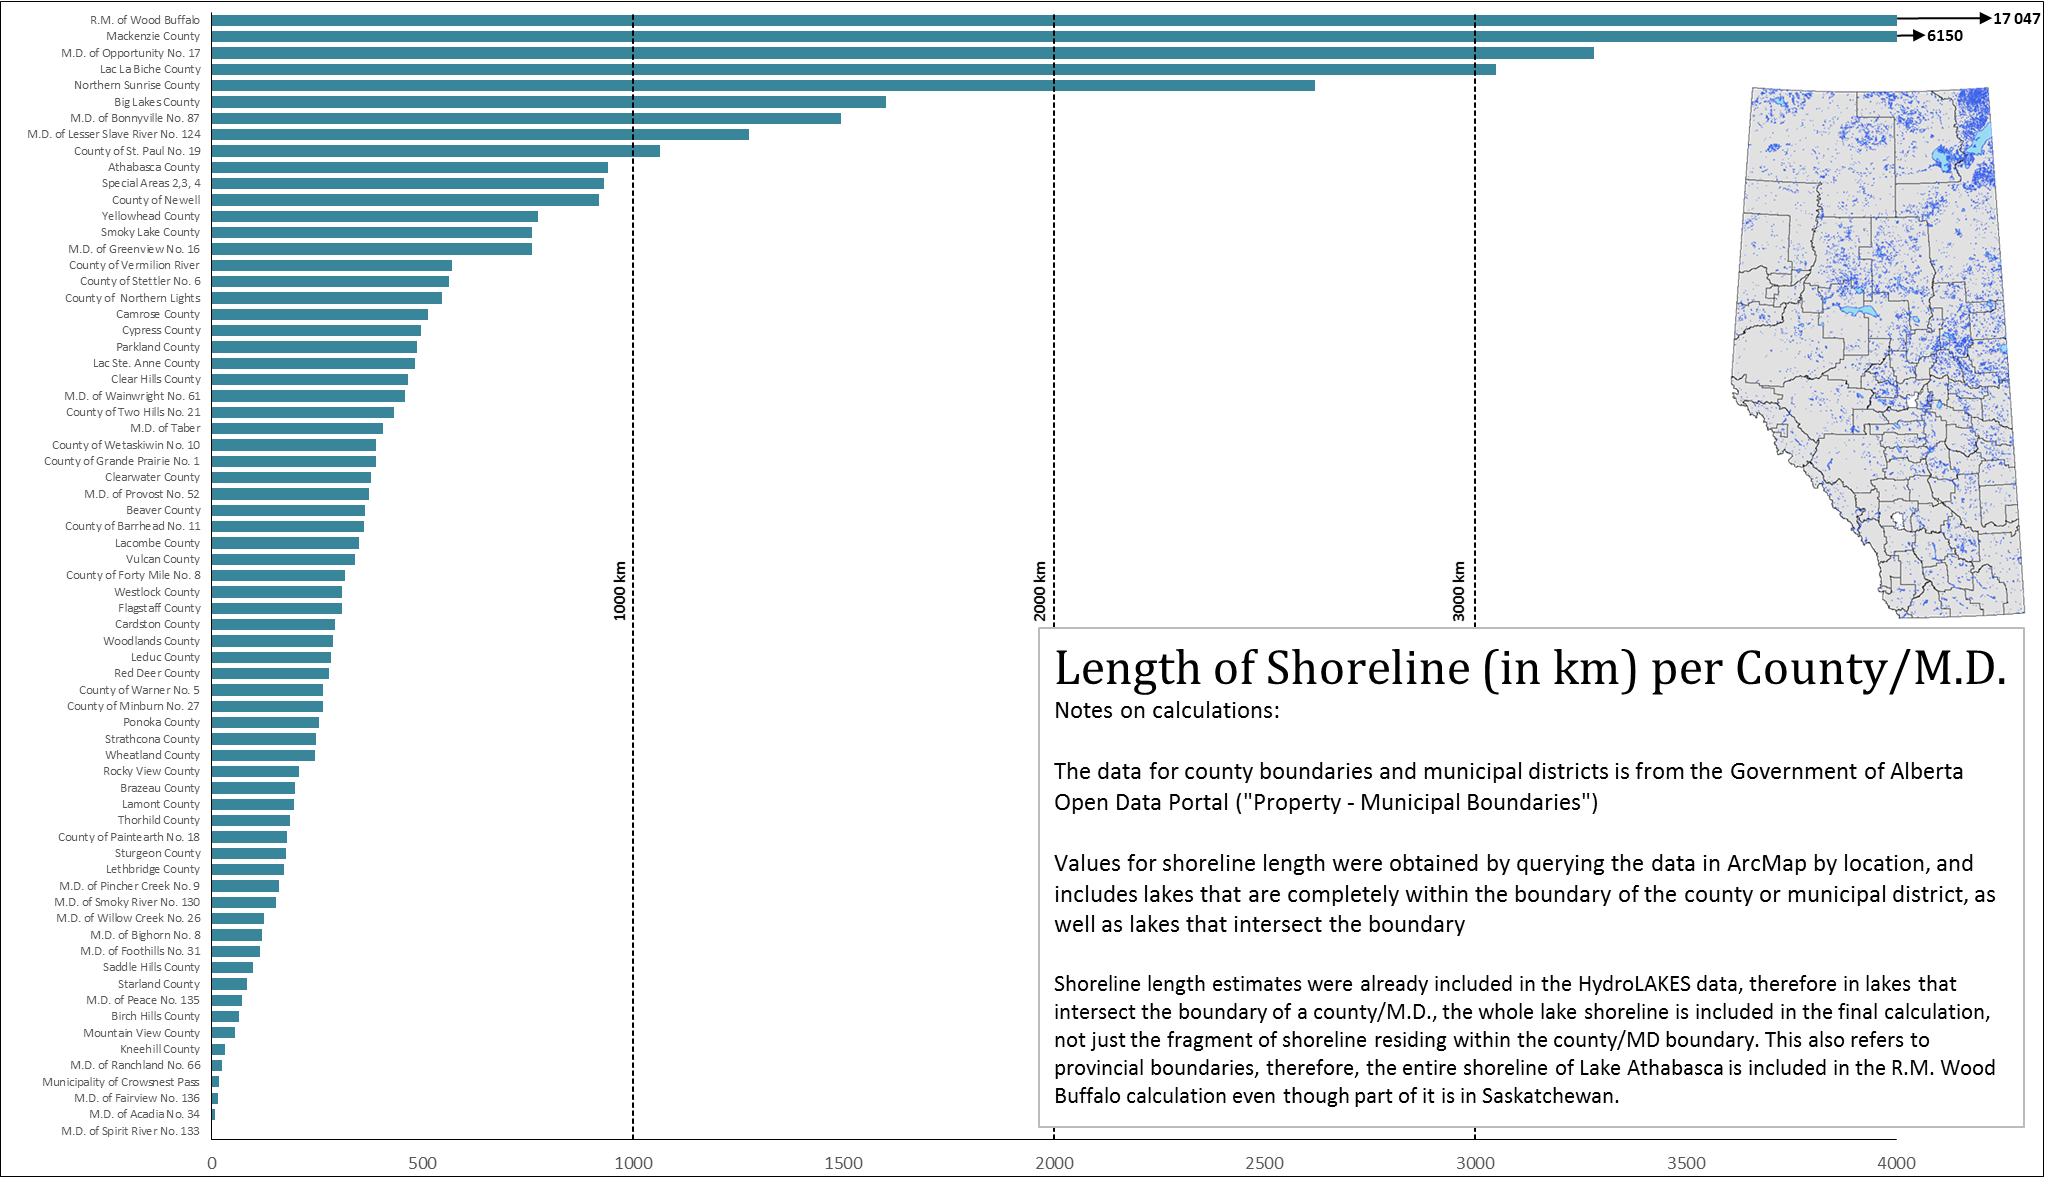
Using the HydroLAKES data set, ALMS has created graphs displaying the number of lakes (≥ 0.1 km²) and the length of shoreline within each of Alberta’s counties and municipal districts. Click on the graphs below to expand the image and do a comparison of districts!
The HydroLAKES Database
In December 2016, researchers at McGill University released a database that aims to provide shoreline polygons of lakes with a surface area of at least 10 hectares (0.1 km²). This database doesn’t just include lakes in Canada, but the whole world! Information for each lake in this database includes estimation of shoreline length, volume, and retention time. To learn more, check out the video below, or read this article from the Montreal Gazette.
Data References
For more information about the HydroLAKES project or to download the data, visit: www.hydrosheds.org/page/hydrolakes
The data for county boundaries and municipal districts used in these calculations is from the Government of Alberta Open Data Portal. The data is freely available to download online, and also includes boundaries for cities, towns, First Nations, Métis settlements, and national parks. Click here to visit the download page, or search “Property – Municipal Boundaries” in the open data portal.
 The members of the steering committee will continue to play a strong role in facilitating and tracking implementation actions. This includes any actions they were responsible for, as well as tracking other committees and sector’s actions and progress made towards achieving the plan’s outcomes. Ongoing communication is essential to successful implementation and achieving outcomes, therefore a regular reporting mechanism could be set up in order to provide regular evaluation of the plan.
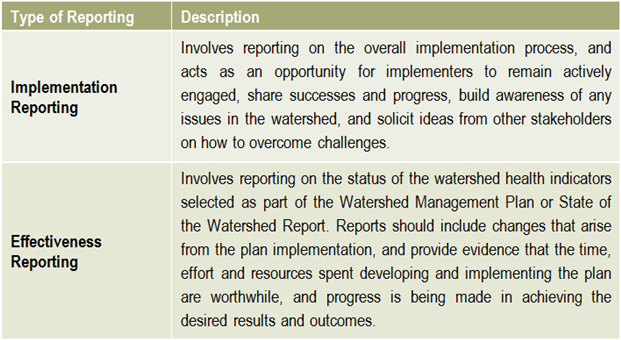 Reporting is an essential component of any watershed management planning and implementation process. There are two main types of reporting that should be shared with stakeholders on a regular basis: implementation reporting & effectiveness reporting.
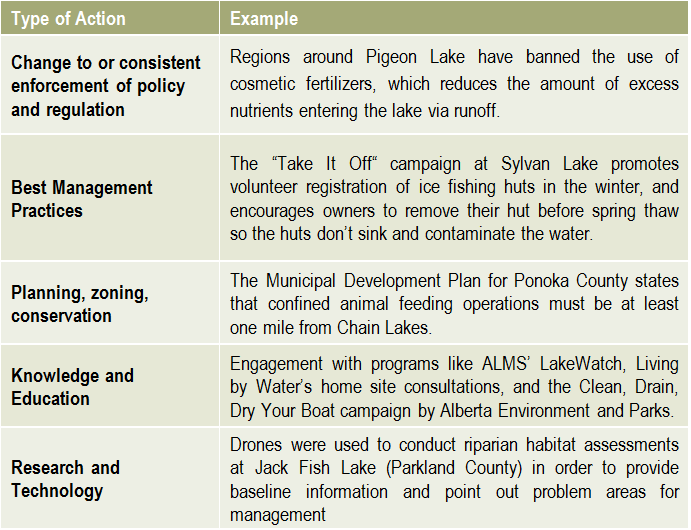 There is no limit to the number or types of lake management actions, but they typically fall into the categories on the right.

 Helpful resources
 The development of a lake watershed management plan provides the guidance needed to implement activities, but the plan cannot be static. Monitoring the performance of your management actions is essential to understanding whether your goals have been met, and whether further actions are needed. Monitoring and evaluating the implementation and effectiveness of a lake watershed management plan allows assessment of progress towards the goals and objectives of the plan, identification of problems and opportunities, and a collection of critical information required when performing a 5 or 10 year review of the plan.
 What has the monitoring results of the plan and of the indicators shown? Is there a need to modify the plan? It is important that the lake watershed management plan does not just sit on a shelf. Information gaps should be addressed, action items need to be managed, completed, and evaluated to best address the needs of the lake. Always keep in mind the vision: if the actions taken are not bringing the lake closer to that vision, then the plan needs to be modified. Consider updating both the state of the watershed and the lake watershed management plans at regular intervals to make sure that the actions taken were achieving the desired outcomes and to evaluate what work still needs to be done.
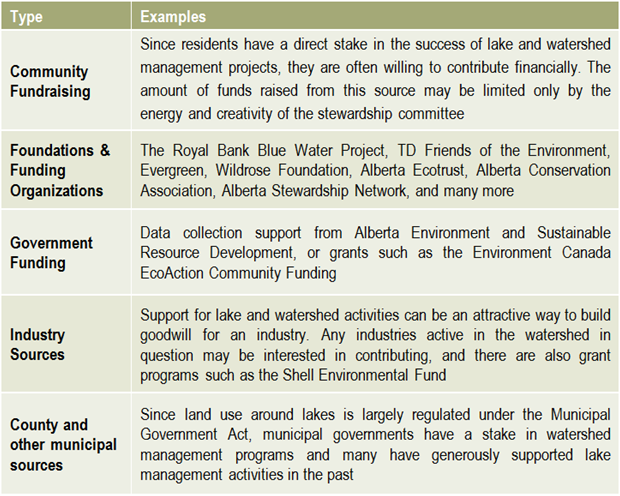 Once a plan has been approved by all affected sectors and officially endorsed and released by the steering committee, then implementation can begin in full. Action projects can be large and comprehensive, or made smaller by staging projects over time or into modules that can be tackled one at a time. Fundraising is an issue that many community groups may find intimidating, but experience with programs such as the Pine Lake Restoration Program (see
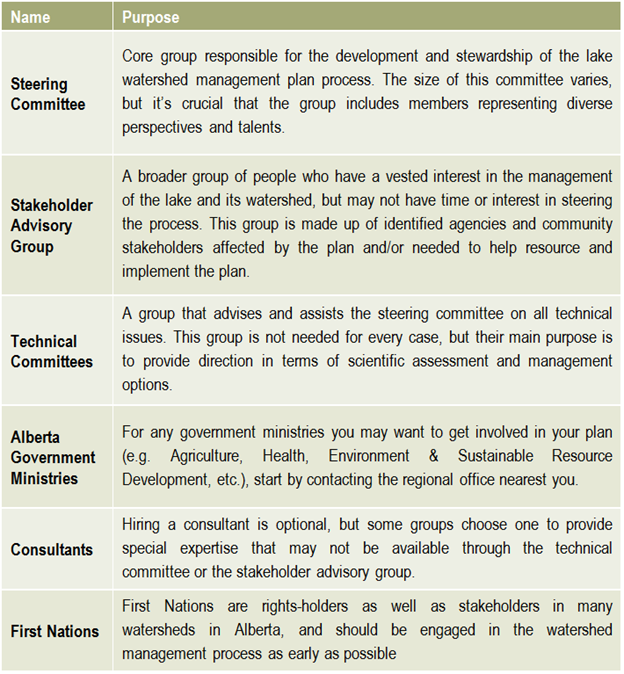
 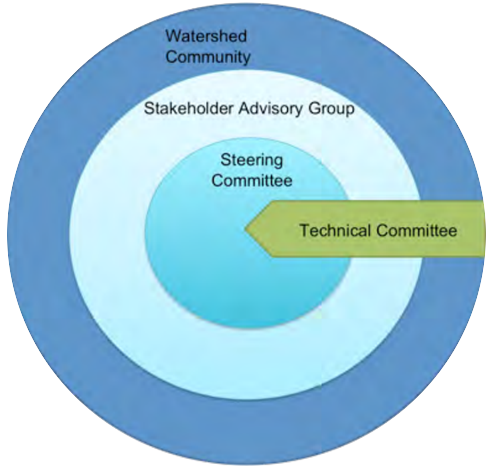 This graphic describes how the various committees and groups will work and interact together. The circle size depicts the approximate number of people involved, and the circles overlapping indicates that some individuals may reside in all of the circles and participate in multiple committees as part of the planning process. The technical committee is shown as an arrow, indicating that it is independent and has relatively few people, and yet it interacts with all of the groups. This graphic may look different depending on the lake and the people involved, and a detailed structure should be agreed upon and described in the plan’s Terms of Reference (Step 6).